
Customer segmentation is the process by which you divide your customers up based on common characteristics. This allows marketers to engage with each customer in the most effective way or make an estimation for their new customers based on previous data.
There’s one more term we’re going to use a lot today and that’s persona. A persona is a fictional character created to represent a user type that might use a site, brand, or product similarly.
Segmentation Workflow
Let’s say you run a mobile app business. You can collect user data such as which country users are from, what device they are using, their gender, age, and how much money they spend using your app. After you’ve had a good amount of data, you can process this data and create segmentations and personas based on your previous or current users. After this point, you can use this knowledge to get a fast estimation about your new users, how they are likely to behave and use your application. You can use different marketing for your product based on your user’s segmentation to increase your profits.

Creating Personas
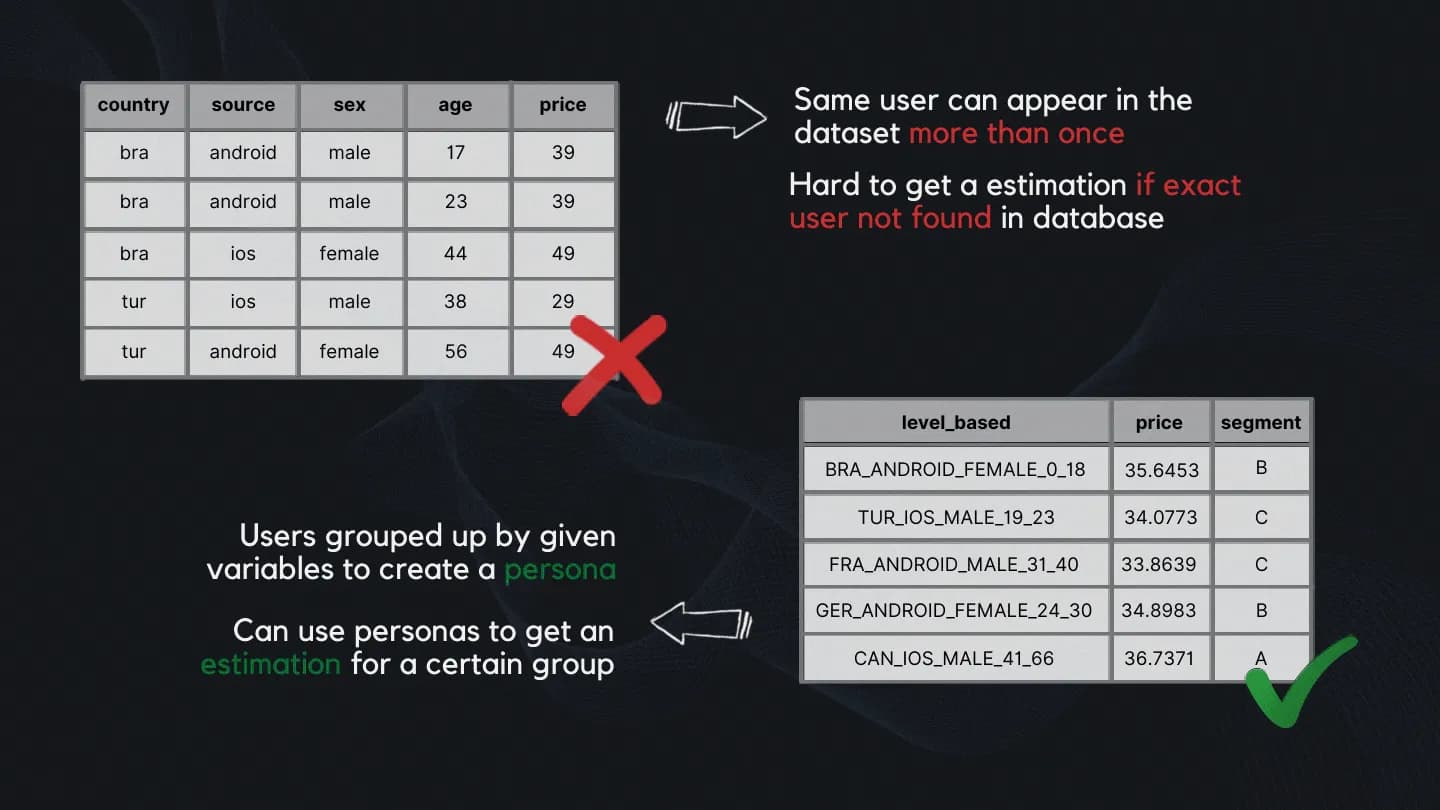
To be able to create accurate personas collecting the data is not enough. First, we have to process the data to a form that holds information in categories. And since we are collecting user data based on their purchases, there may be duplicates in our data. The same customer can make 2 purchases and appear as 2 different customers.
Exploring and Processing the Data
Let’s go through exploring and processing the data step by step. Let’s start with exploratory data analysis(EDA).
# Unique Sources and Frequencies
df.SOURCE.value_counts()
# Unique Prices and Frequencies
df.PRICE.value_counts()
# Unique Countries and Frequencies
df.COUNTRY.value_counts()
# Total Income Accumulated by Countries
df.groupby('COUNTRY').PRICE.sum()
# Average Income Accumulated by Countries
df.groupby('COUNTRY').PRICE.mean()
# Average Income Accumulated by Sources
df.groupby('SOURCE').PRICE.mean()
# Average Income Accumulated by Countries and Sources
df.groupby(['COUNTRY', 'SOURCE']).PRICE.mean()
# Average Income Accumulated by Countries, Sources, Sex and Age
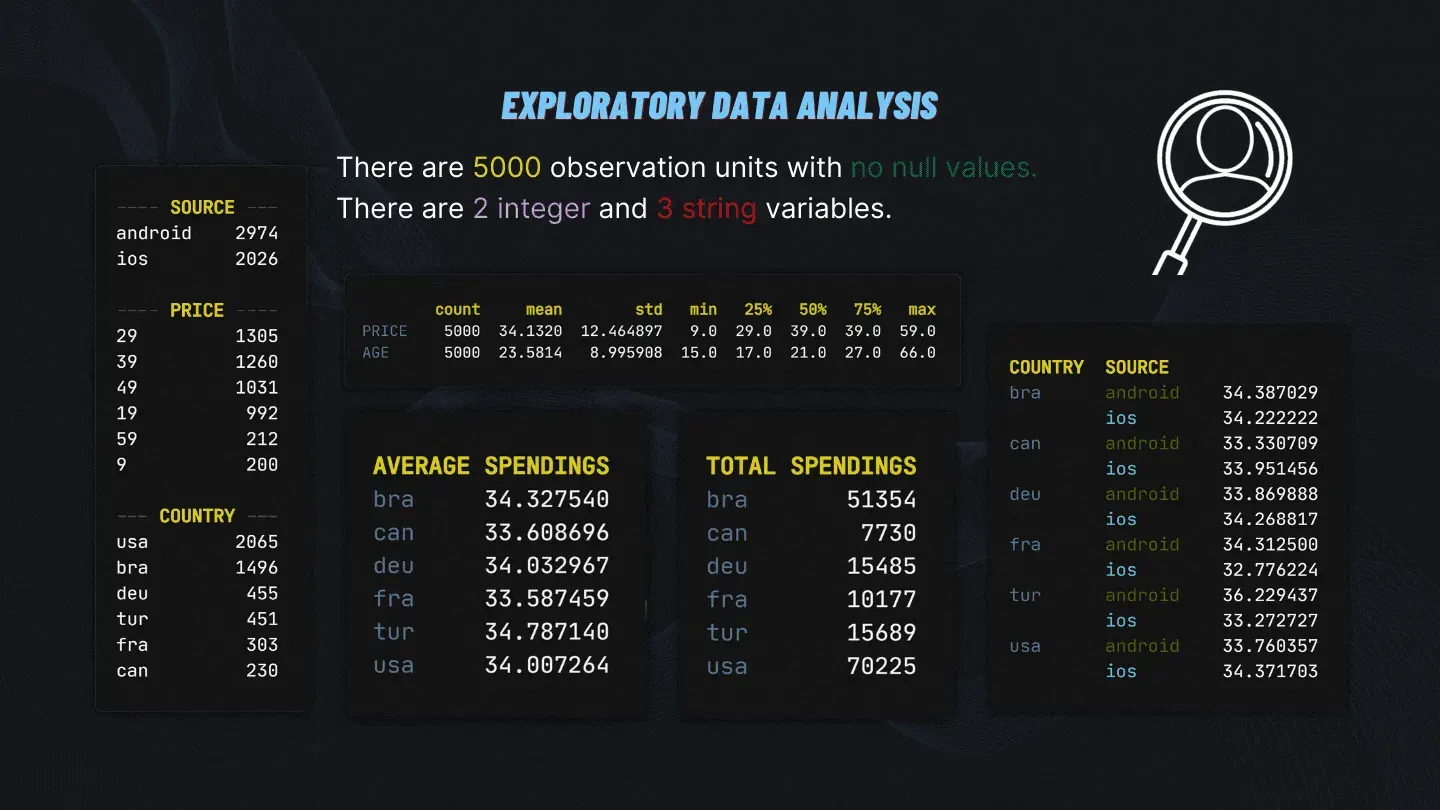
df.groupby(['COUNTRY', 'SOURCE', 'SEX', 'AGE']).PRICE.mean()EDA gave us a quick overview of our data can be seen below.
There are 2 unique sources, 6 unique prices, and 6 unique countries available in the dataset. The minimum age is 15 while the maximum is 66. Brazil is the country with the most money spent while Turkey has the highest money spent per person.
Based on our EDA we can create an aggregated dataframe, sort the values by price in descending order and reset the dataframe’s index to fix possible level issues later on. We will call this dataframe agg_df.
# Creating an aggregated dataframe for mean values
agg_df = df.groupby(['COUNTRY',
                     'SOURCE',
                     'SEX',
                     'AGE']).PRICE.mean().sort_values(ascending=False)

# Reseting index to fix level issues on our dataframe
agg_df = agg_df.reset_index()
This aggregated dataframe still doesn’t hold information in categories and can’t be generalized and used for estimation. It still suffers from the same problem we discussed earlier. Unless we don’t put in the exact age available in the dataset we won’t get an estimate. To fix this do the following:
# Creating age categories which will hold information in "buckets"
agg_df['AGE_CAT'] = pd.cut(x=agg_df['AGE'], bins=[0, 18, 23, 30, 40, 66, 100],
                           labels=["0_18", "19_23", "24_30", "31_40", "41_66",
                                   "67_100"])
Now we will put the information in our columns in an easily reproducible format.
# Concatenating columns
agg_df['customers_level_based'] = agg_df[
    ['COUNTRY', 'SOURCE', 'SEX', 'AGE_CAT']].apply(
    lambda x: x.str.upper()).agg(
    "_".join, axis=1)
After grouping up and concatenating our columns there’s still a major problem. Since we hold information in categories called personas, there will be duplicates.
For example, there will be a FRA_ANDROID_FEMALE_24_30 persona for every entry available between ages 24 to 30. To fix this we group by customers_level_based column and get the mean price for the category.
# Removing duplicate categories
agg_df = agg_df.groupby(
    'customers_level_based').PRICE.mean().reset_index()

# Sorting values
agg_df.sort_values('PRICE', ascending=False, inplace=True)

# Reseting index for fixing level issues
agg_df.reset_index(inplace=True, drop=True)Since we created our personas and removed duplicates, now we can create our segments.
# Creating segment by quantiles (A: best, D: worst)
agg_df['SEGMENT'] = pd.qcut(agg_df.PRICE, 4, labels=['D', 'C', 'B', 'A'])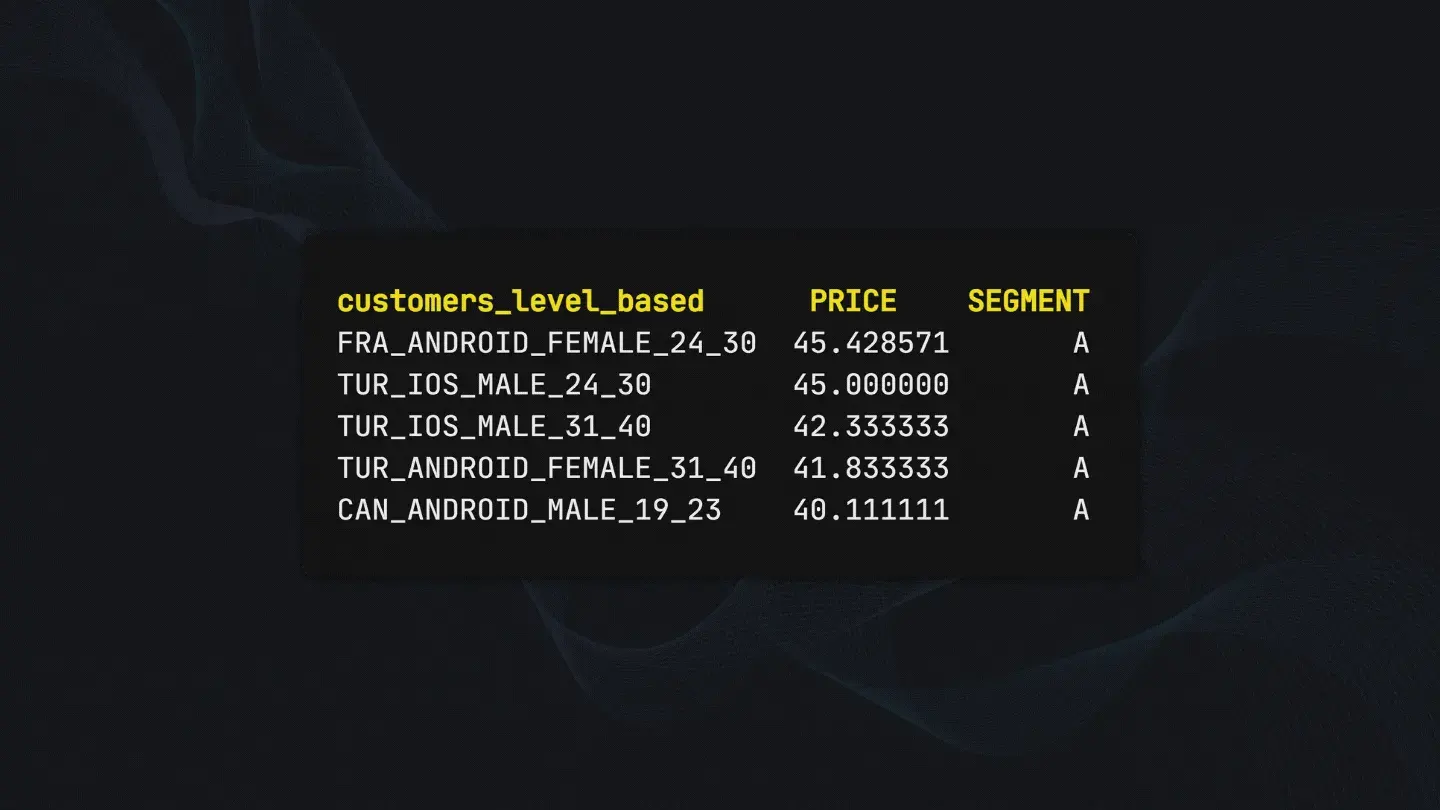
Now we have ourselves rule-based classified data that we can use to get quick about our new user’s estimated spending and segment information.